Impact graphs
One of the ways of inspecting the environmental impact of your products, components and packaging is by exploring their impact graphs. These graphs can be found at the top of an entity's page, or at the bottom of the entity property sidepanel:
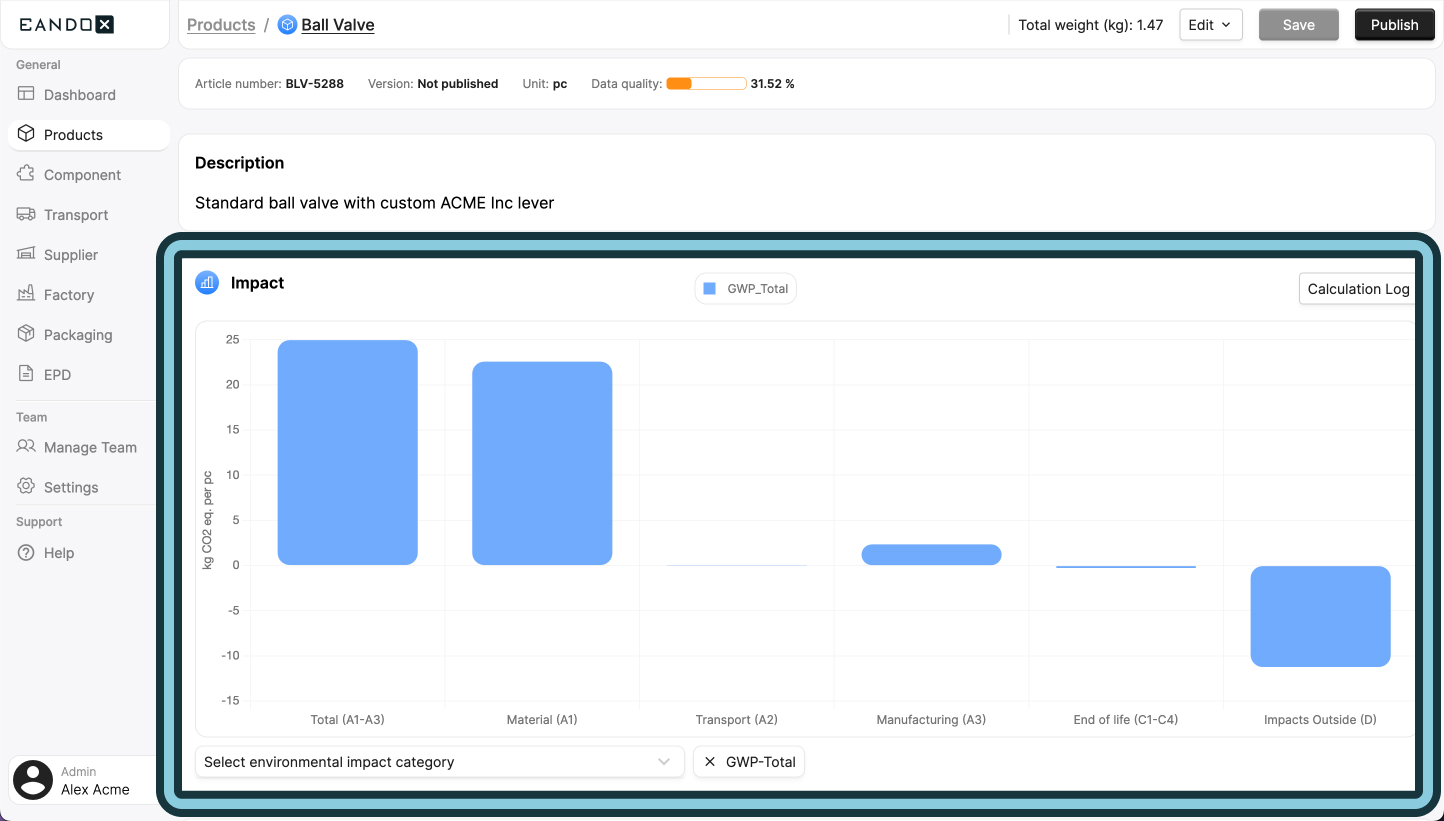
Nothing in the graph?
If you don't see anything in the graph, it's likely that you haven't entered any data yet.
Make sure to fill out all the necessary data fields, and click Save to save the data. This will trigger the LCA calculations, and update the impact graph.
View modes
The impact graph has two view modes, the Graph, and the Calculation Log.
Graph mode
The Graph mode shows all the data points as a bar graph:
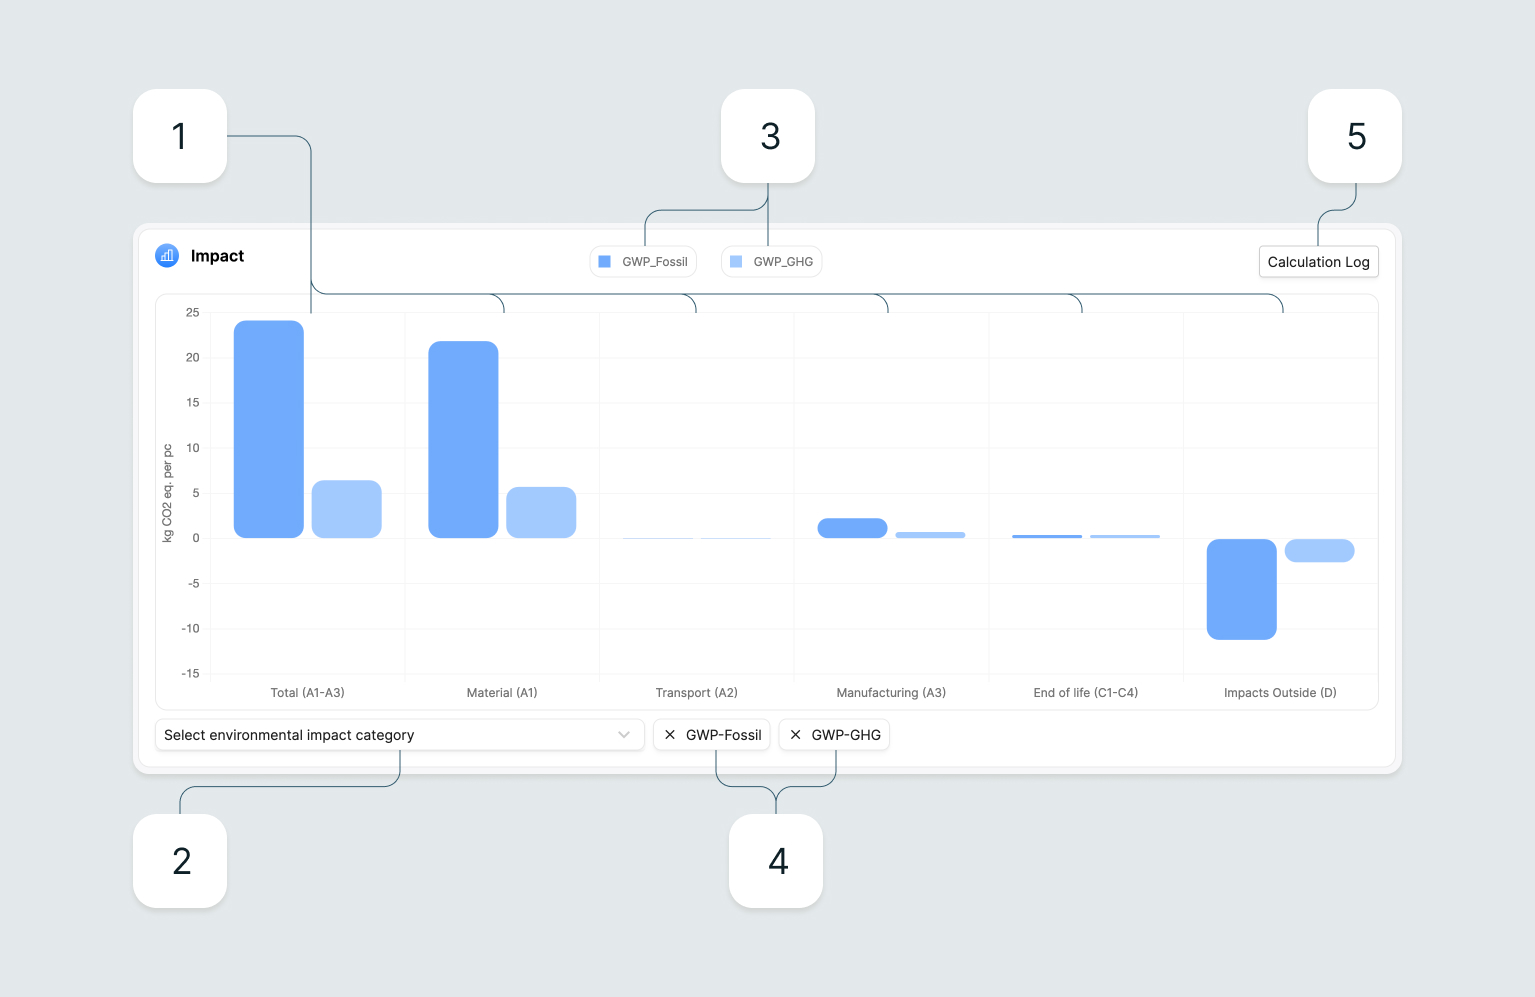
- Data points: The data points for the calculated environmental impact. Each value is clickable, allowing a detailed view of the data point, sometimes with multiple sub-points.
- Impact category selector: Selects which calculation results to display in the graph. While the Global Warming Potential (GWP) is the most commonly used, many other options are available. Multiple categories can be selected at once.
- Bar legend: Shows what the different colors in the graph represent.
- Selected impact categories: Shows what impact categories are currently selected in the graph. Clicking a category will unselect it, and hide it from the graph.
- Calculation Log: This button will toggle the view mode from the Graph to the Calculation Log.
Calculation Log mode
The Calculation Log mode shows how all the data points were calculated from the raw supply chain data:
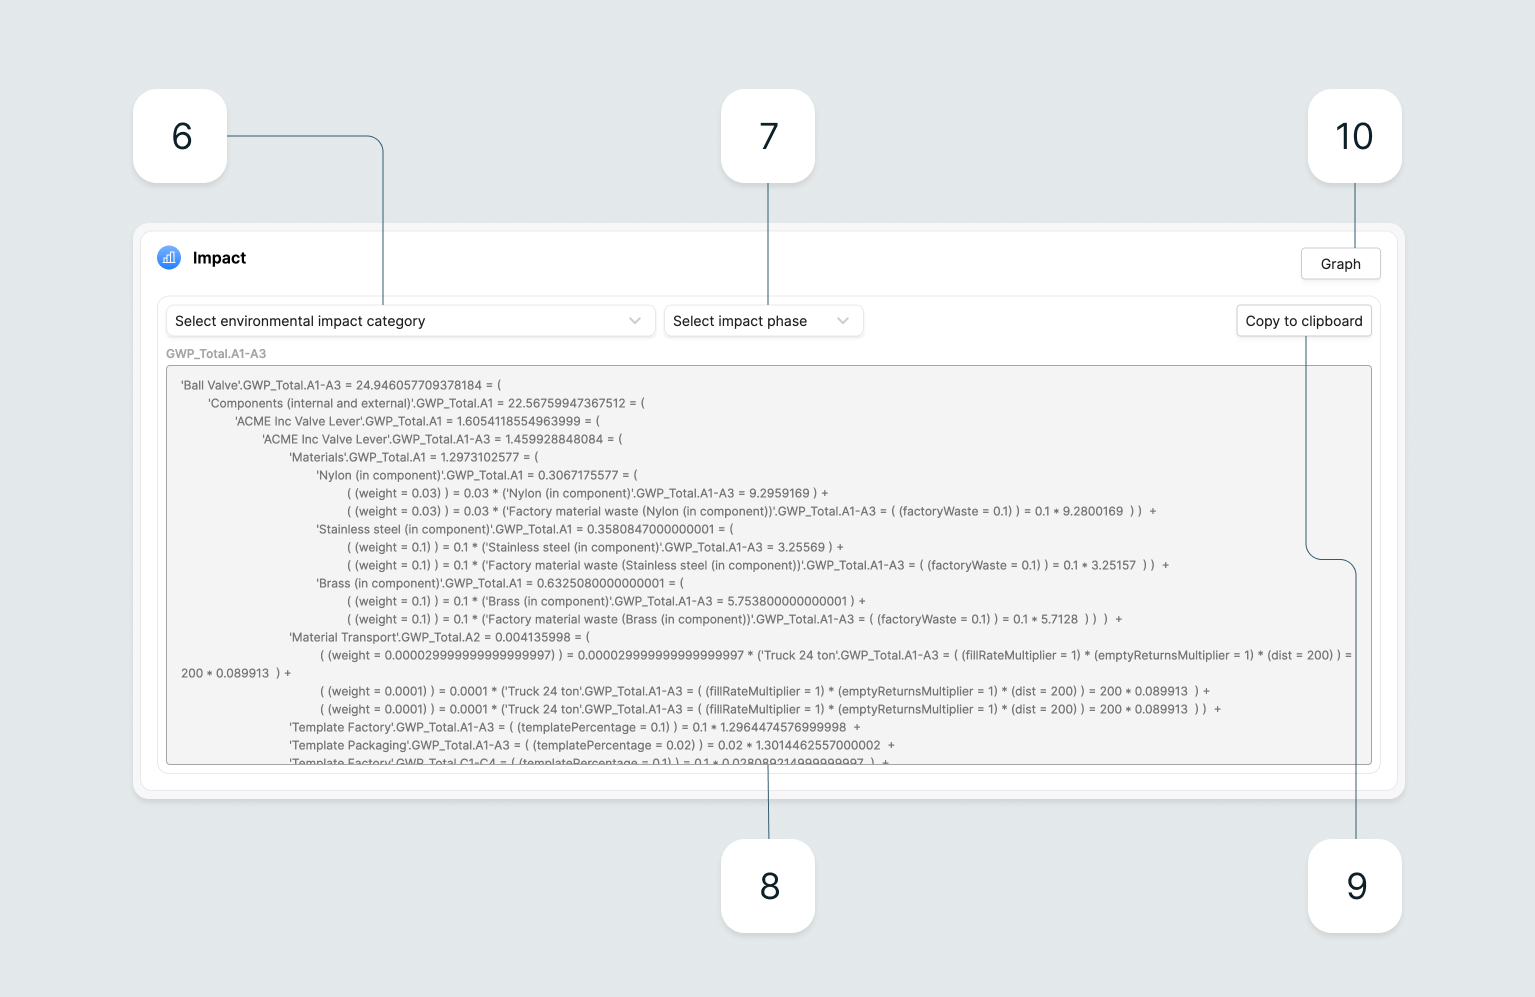
- Impact category selector: Selects what category of data to display. Used together with the Impact phase selector to show a specific calculation.
- Impact phase selector: Selects which calculation to display in the log, based on the selected category.
- Calculation log: Shows the calculation log for the selected category and phase.
- Copy to clipboard: Copies the calculation log to the clipboard.
- Graph: This button will toggle the view mode from the Calculation Log to Graph.